Confusion_matrix
Used to display the performances of a classification model when applied on dataset
Instances
Only one instance of the confusion matrix is available right now, it uses two different graphical component depending on the abstraction level.
Configuration
Type configuration with specific parameter that need to be describe
   ./config.json

   "metrics": [
    {
      "name": "CONFUSION_MATRIX",
            "scope": "datasetModel",
            "type": "confusion_matrix",
            "title": "Confusion matrix",
            "description": "Confusion matrix description",
            "tooltip": "Tooltip operation roi",
            "config": {
                "horizontal_list": [
                    "Predicted",
                    [
                        "Positive",
                        "Negative",
                    ]
                ],
                "vertical_list": [
                    "Ground Truth",
                    [
                        "Positive",
                        "Negative",
                    ]
                ]
            }
        },
Payload
    ./payload.json


        {
            "metricName": "CONFUSION_MATRIX",
            "values": [
                [
                    8345,
                    35,
                    10
                ],
                [
                    27,
                    235,
                    5
                ],
                [
                    2,
                    2,
                    2
                ]
            ]
        }
Representations
Company Level representation
Two different instances :

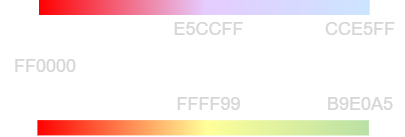
Color scheme for the different gradients :

Cells depicted in white will follow the top gradient, cells depicted in grey will follow the bottom gradient.
Project Level representation
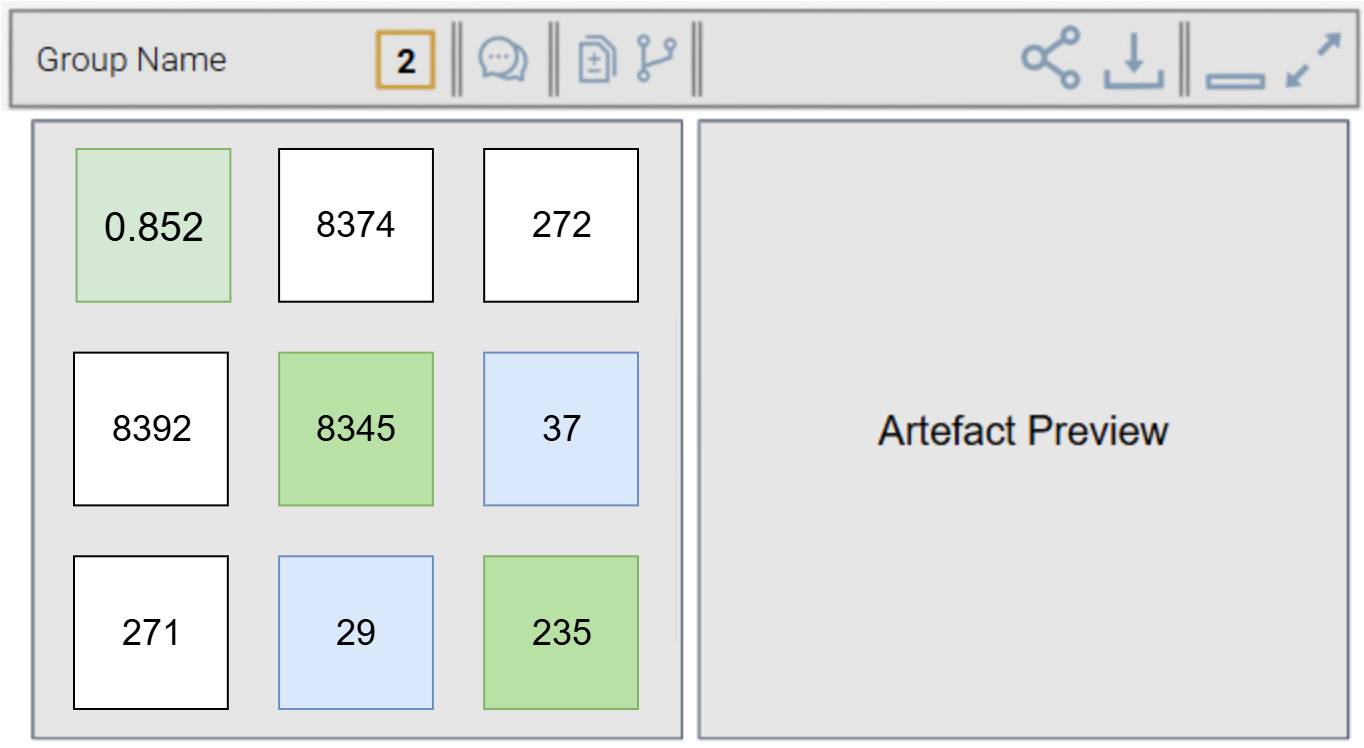
Color Ratio Diagonal = Green Others = Reddish Total per line = Blue
MCC Ratio = red to green. MCC Ratio formula 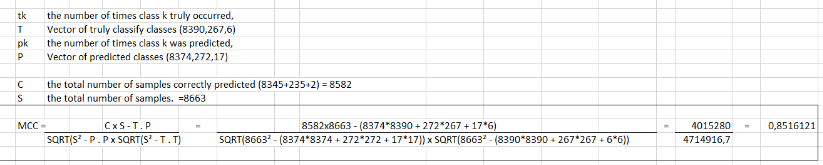
InDepth Level representation
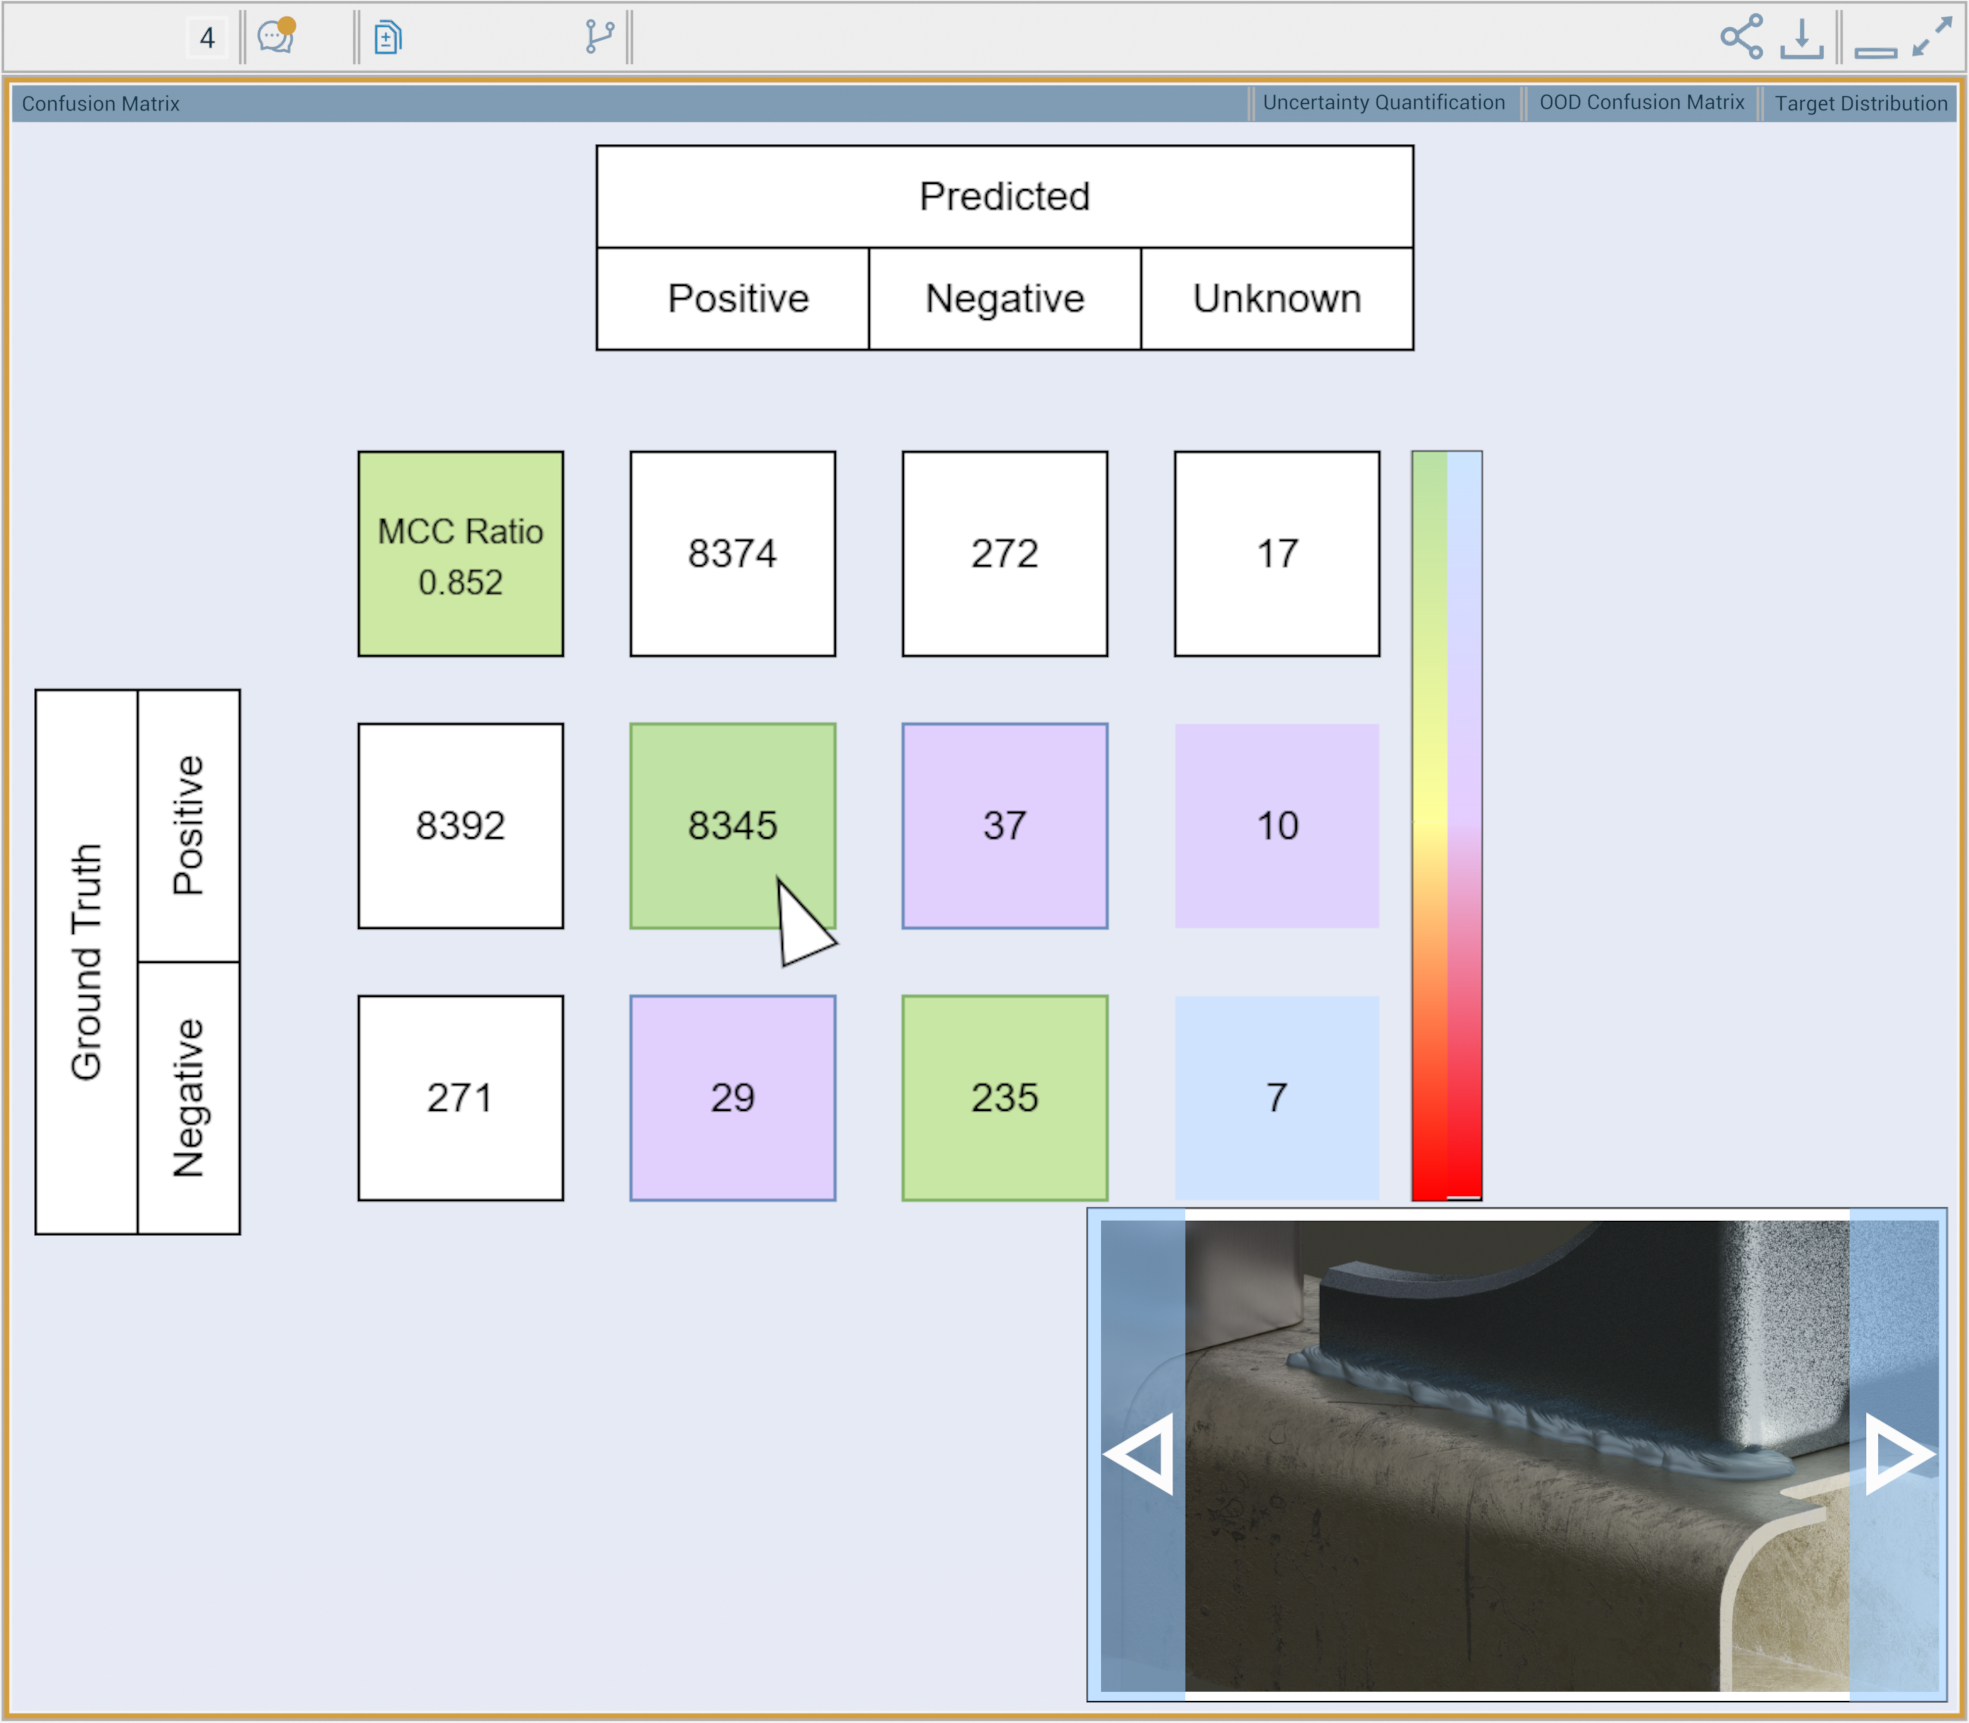
- clicking one of the cell (see the mouse cursor) will display content in a sample viewer at the bottom of the matrix. This sample is of course made of picture/elements from the selected cell.
Comparing with multiple models
Clicking the diff/compare option in the toolbar will open a list with checkboxes containing the different version that can be compared with the current one.
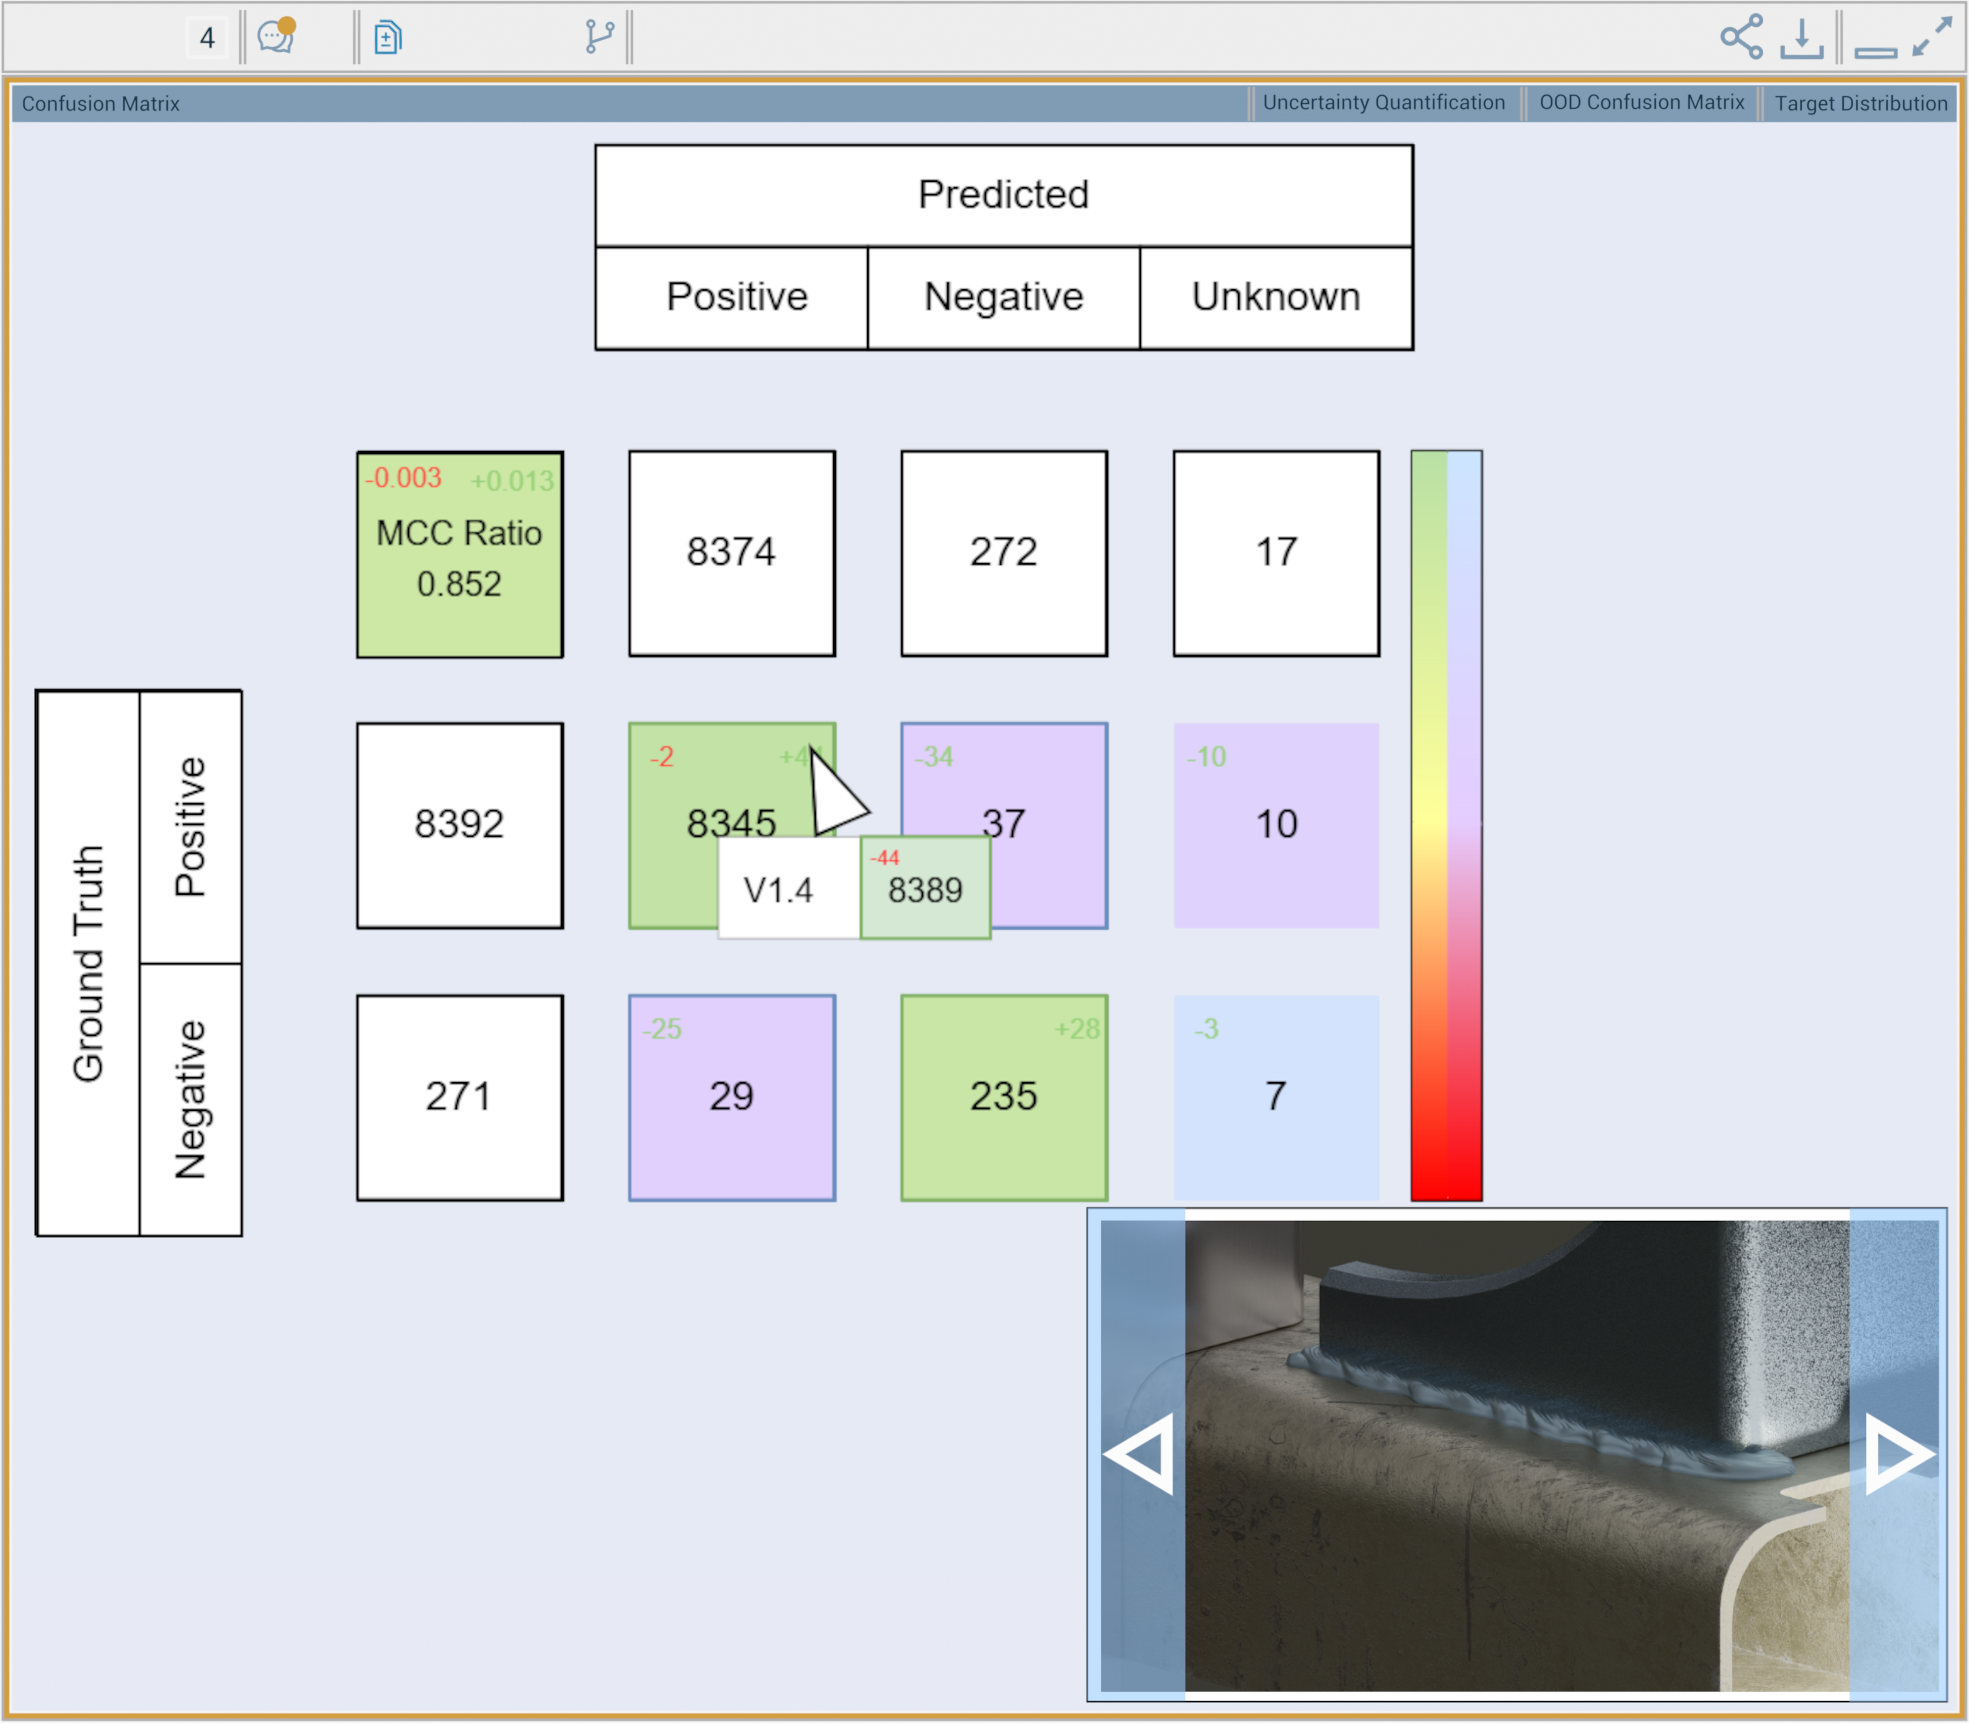
When comparison is active, each cell will display :
in top left corner the difference with the smallest value found for this cell among all the compared versions.
in top right coner the difference with the highest value found for this cell among al the compared versions.
it is displayed in red if the difference indicates the result is worst than the actual version.
it is displayed in green if the difference reveals a better result than the actual version.
- (E.G. here, on the cell 8345, among all the compared models, the model with the lowest value for this cell has a value of 8343 which is the (-2) indicated in top left corner. The model with the highest value has 8389 which is the (+44) indicated in top right corner.
- as the ground truth value here is 8390, it means the 8389 is closer to the ground truth value, though the differnce appears in green.
Navigating over a Diff will display an infobox with the associated version, the cell value and the diff with the actual version.