Chart
It is an artefact that allows to display any type of chart ( roc_curve ..)
Instances
Only one instance of the Chart is available right now
Configuration
The metric integrated into the kd-front-metric package uses ECharts. The config key must therefore contain an ECharts option object. Refer to the documentation or an example for more information. The configuration also accepts the thumbnail key. This key allows you to define the image displayed on the company view. If it is not defined, there will be no display for this abstraction.
   ./config.json

    "metrics": [
        {
            "name": "Chart",
            "scope": "foo",
            "type": "chart",
            "title": "chart metrique",
            "description": "A ROC (Receiver Operating Characteristic) curve evaluates a model's performance by comparing true positive and false positive rates",
            "tooltip": "ROC (Receiver Operating Characteristic)",
            "config": {
                "thumbnail": "https://.../roc_curve_thumbnail.png",
                "yAxis": {
                  "type": "value"
                },
                "tooltip": {
                "trigger": "axis"
                }
            }
    },
Payload
The metric integrated into the kd-front-metric package uses ECharts. The values key must therefore contain an ECharts option object. Refer to the documentation or an example for more information.
Note that the metric will use the previously provided configuration and will perform a shallow merge of the values in the values key. This means that any key provided in the config that is also present in the values of the payload will be overwritten by the value in the values key. The configuration key is therefore used to store all the common information among all metrics of this type.
./payload.json
{
"metricName": "chart",
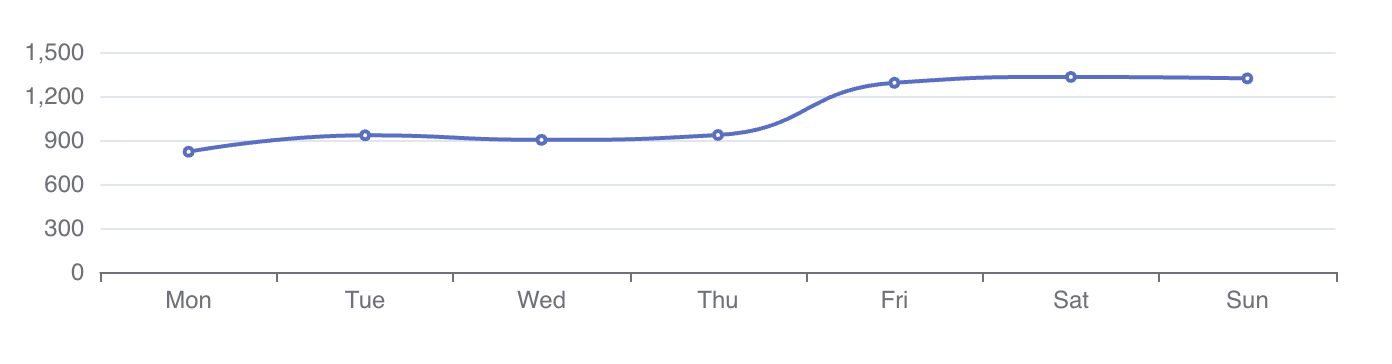
"values": {
"xAxis": {
"type": "category",
"data": [
"Mon",
"Tue",
"Wed",
"Thu",
"Fri",
"Sat",
"Sun"
]
},
"series": [
{
"data": [
820,
932,
901,
934,
1290,
1330,
1320
],
"type": "line",
"smooth": true
}
]
}
}Representations
Company level representation
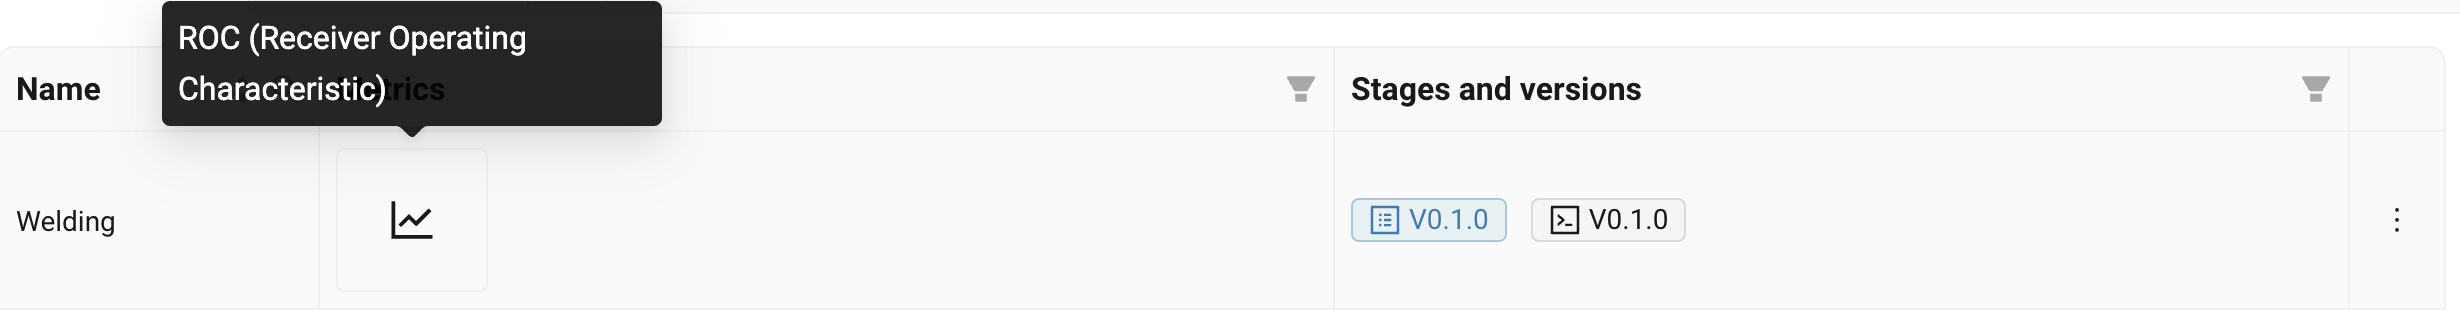
In this example, the infoxbox is also displayed.
Project level representation
InDepth level representation
same as project